Our InSAR service turns satellite radar into millimetre-scale ground-movement
measurement — subsidence, uplift and instability over mines, gas fields, tailings
and infrastructure. Below: the service demonstrated live, on 11.2 million
measurement points across the Surat Basin and Southeast Queensland.
The collection: Surat Basin & Southeast Queensland — live below ·
Mt Isa region — 1,888 radar scenes banked, processing next
What the map shows
Radar interferometry (InSAR) measures millimetre-scale ground movement from orbit by
comparing the phase of radar echoes between satellite passes. Over the Surat Basin,
the dominant signal is subsidence associated with coal-seam-gas water
extraction — coherent, kilometre-scale bowls over the producing fields,
moving steadily at up to ~25 mm/yr. Under our strictest reliability screening,
strong subsidence is about four times more concentrated in the CSG country than
anywhere else on the map, and half of it moves with clean, steady, linear motion —
the signature of a real geomechanical process rather than surface noise.
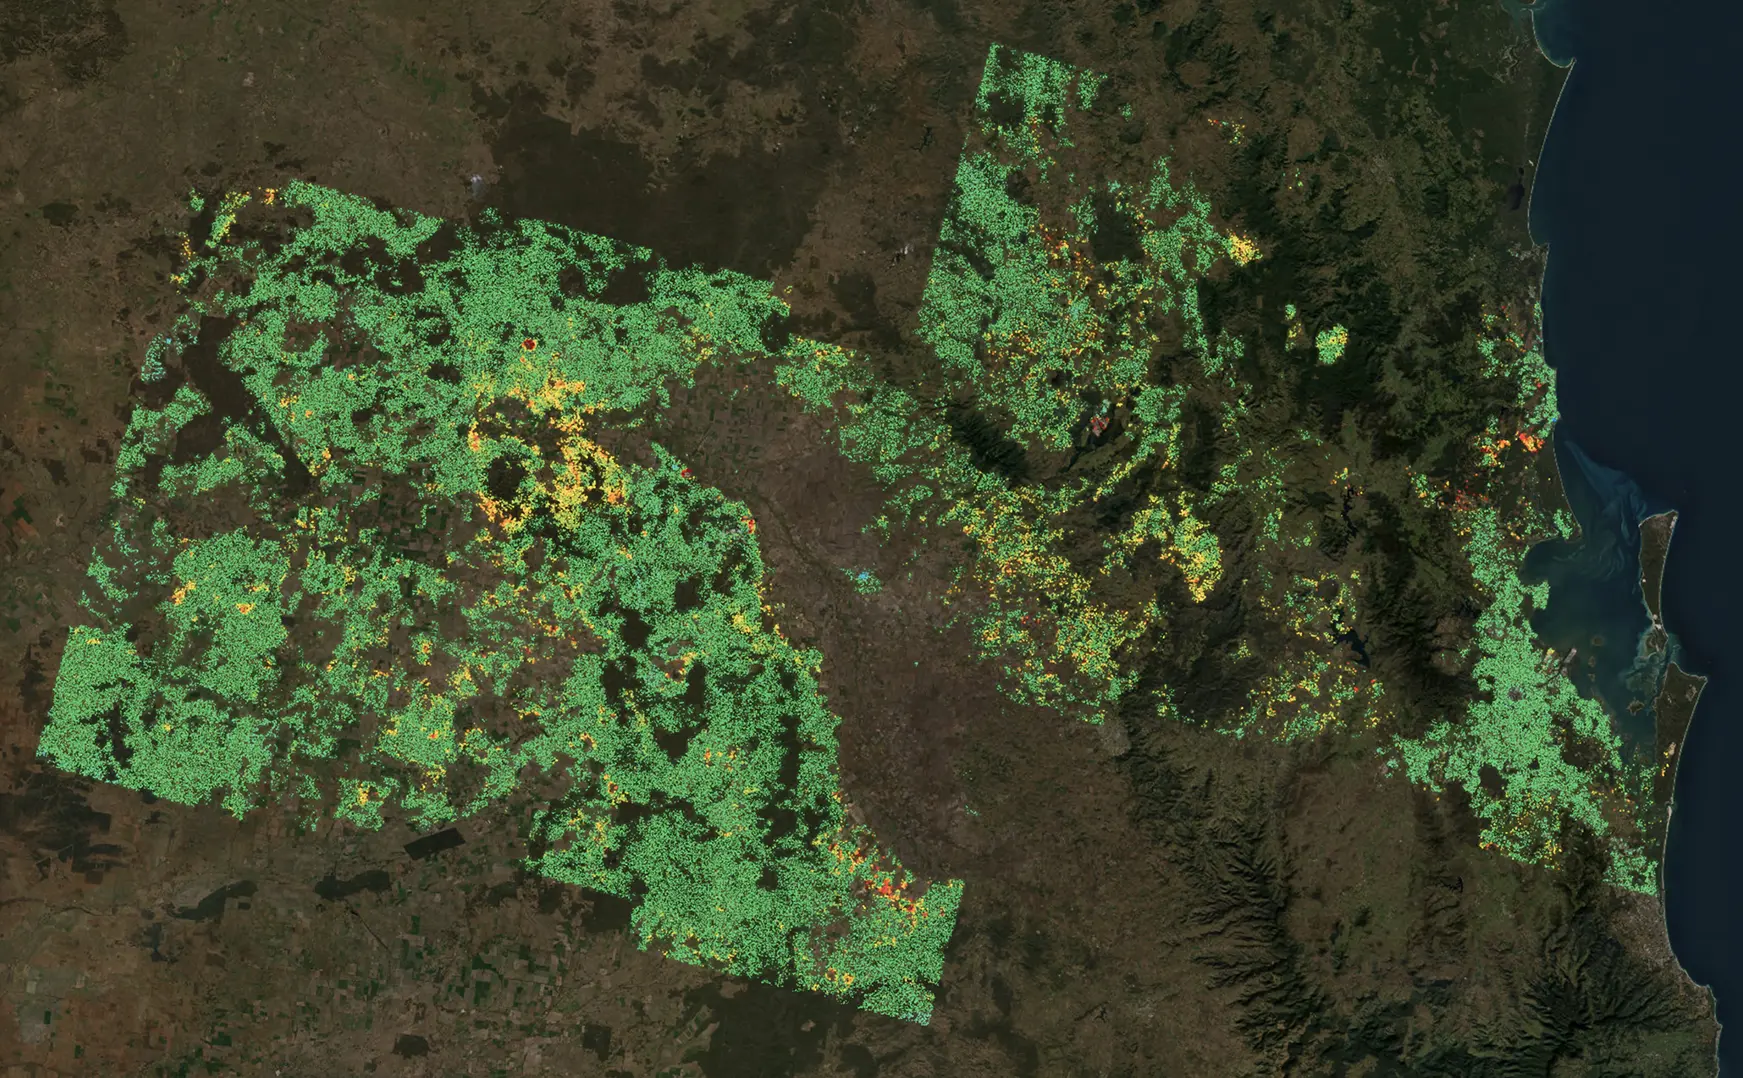
11.2 million measurement points across the two Sentinel-1 frames — stable ground in
green, subsidence in yellow through red. The western frame covers the Surat gas
fields; the eastern frame runs through Brisbane's hinterland to the coast.
How it's made — and why you can trust it
Every point on the map carries three stored time-series: the raw
single-pixel measurement, a version with per-date atmospheric ramps removed, and a
neighbourhood-averaged clean series. The map's headline velocity is, by construction,
the fitted trend of that clean series — and every point's card
checks this arithmetic live and shows the result. If a number can't
reproduce itself, the card says so in yellow.
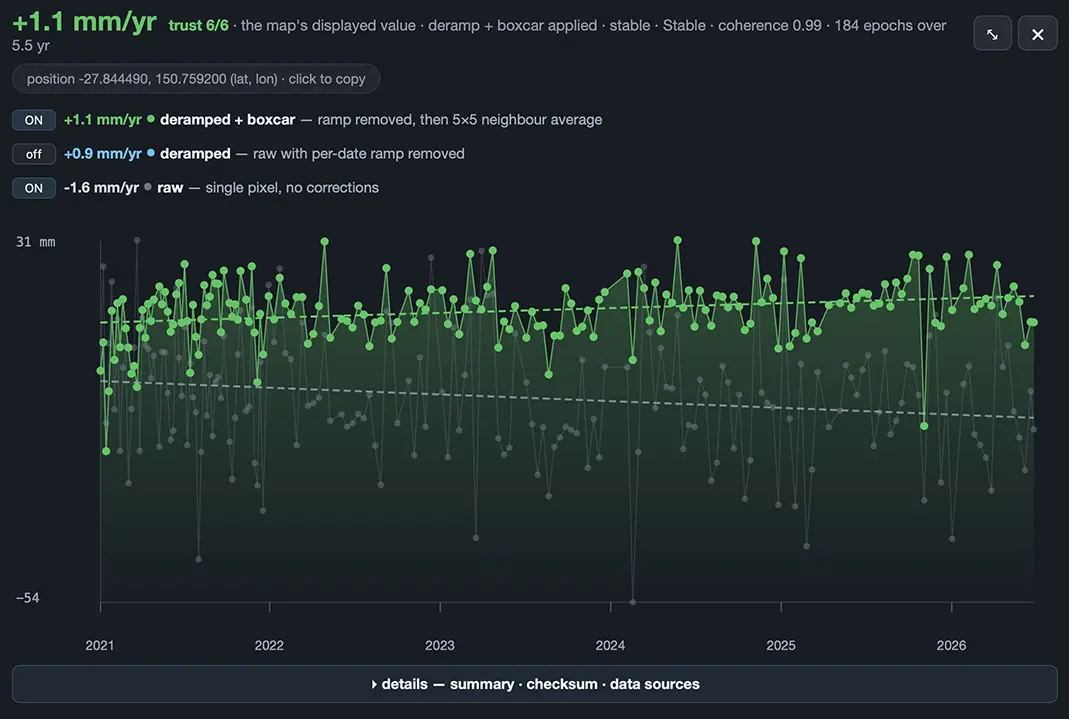
One point's card: five and a half years of movement history, the raw and corrected
series side by side, and a trust score of 6/6 — the headline wears the dot's own
colour, and goes yellow if its arithmetic ever fails to check out.
The whole build is stamped: source radar products, masks, thresholds, reference
definitions and processing steps are hashed into a machine-readable manifest at build
time. When we say a number came from somewhere, that isn't a claim — it's a record you
can follow from the pixel on your screen back to the satellite acquisition.
Each point also wears a trust score (0–6) — how many of our six
strictest reliability gates it passes (unwrap consistency, temporal coherence,
vegetation stability, seasonal swing, coherence floor, and soil-moisture behaviour) —
and a single trust dial on the map sweeps continuously from "show me everything" to
"show me only what survives the hardest questions". We rank; we don't hide.
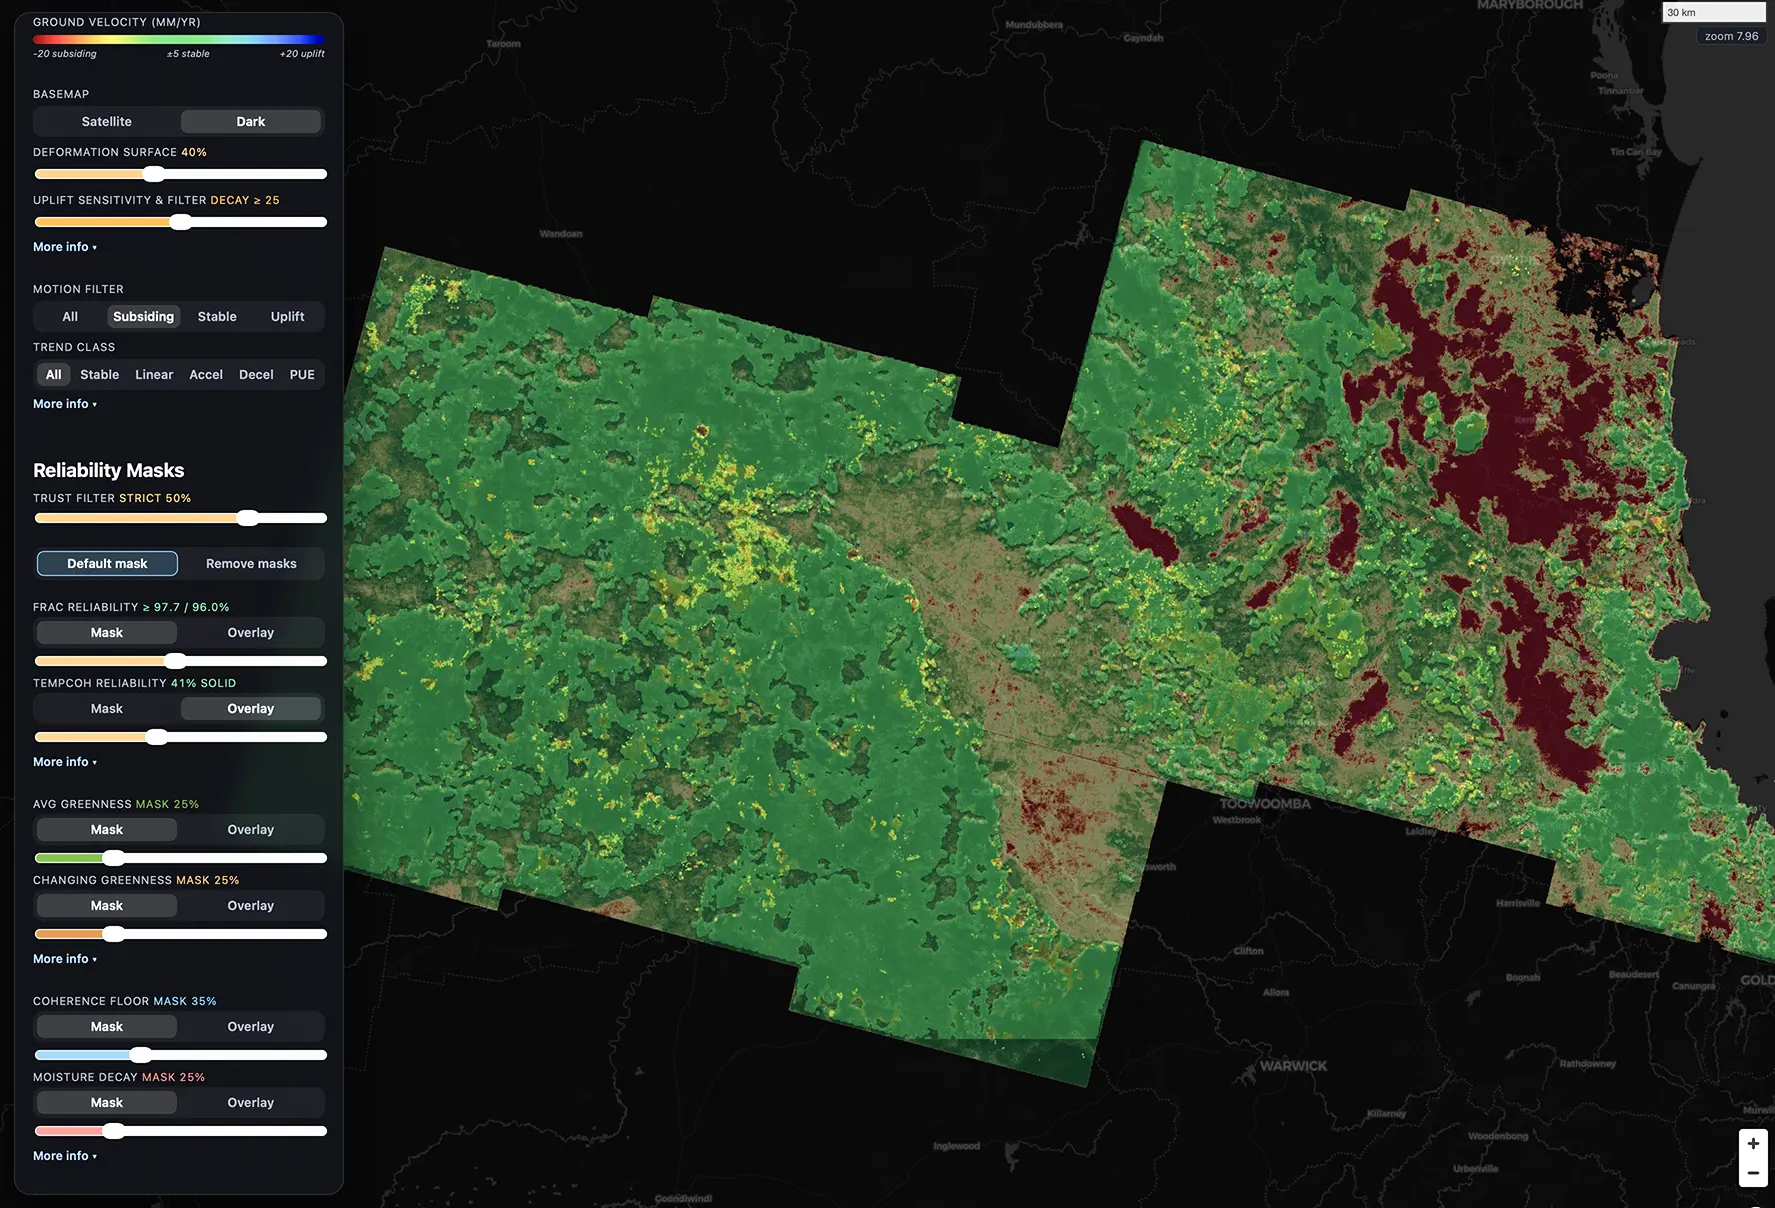
The viewer in full flight: reliability overlays painted across both frames, the
trust dial at strict, and every control honest about what it removes.
Validation against ground truth
The map is checked against 28 independent GNSS stations across the
region, several with continuous records longer than a decade. Regional agreement is
within a few millimetres per year, and — unusually for this industry — we publish the
residuals rather than hiding them: a documented terrain-correlated bias remains in the
coastal frame, a known artefact of C-band processing over vegetated terrain, with a
refinement build planned. Uplift signals co-located with moisture-cycling soils are
flagged as such on the map itself, because honest instrumentation beats pretty colours.
The same pipeline that built this map runs anywhere Sentinel-1 looks: mine sites,
tailings storage, gas fields, linear infrastructure, coastal assets. If ground
stability decides outcomes for your operation,
talk to us about a monitoring feed with the same standard of
evidence — measured, validated, and provable.